Browse Category by Financial Freedom
Early Retirement, Financial Freedom, Financial Independence, Financial Journey, Financial Planning, Investing, Lifestyle, Money Habits, Retirement Planning

This is Financial Freedom: June 2017 Non-W2 Incomes Report & Bi-annual Recap

In this article, I share our financial freedom number, our 2017 bi-annual recap of non-W2 incomes and the wealth building strategies we use to grow our daily worth.

Our Financial Freedom Number

A little over a year ago, I started taking my financial learning seriously (you can read my story here). I read that financial freedom (financial independence) is reached when one has enough passive and/or residual incomes to cover all basic expenses. Certainly, “basic” is a relative word, however you’d like to define that for yourself or your household.

My husband and I have calculated that our basic monthly expenses is about $3,500. This number includes $1400 for housing (utilities included), $1,000 on groceries plus dining out/entertainment once per week; $300 on personal/household expenses, $80 on phone services, $250 on various insurances we carry, $200 on vacation, $120 on gas/car, $50 for charity, and $100 on the unaccounted items/events (e.g., gifts).

June 2017 Non-W2 Incomes Report and Bi-annual Recap

Once we summed up our June 2017 non-W2 incomes and did a bi-annual recap, the numbers in front of us confirmed that we’ve reached the financial freedom stage.

Below is a chart detailing our June report.

June 2017 non-w2 incomes report

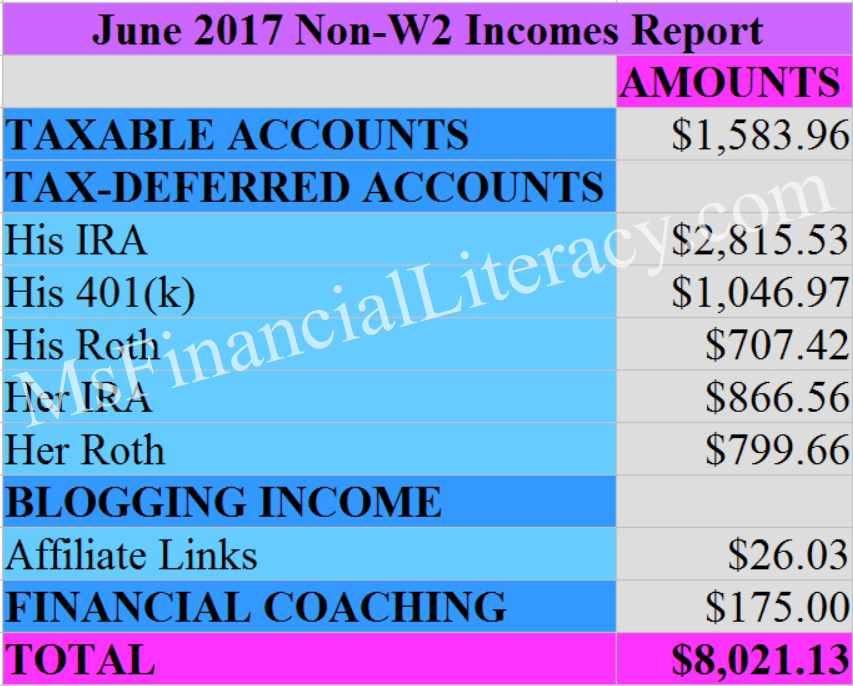
For months, we anticipated that June was going to be an amazing month for us. To our surprise, the total amount we received way exceeded our expectations. This number is bigger than the one from our December 2016 report (typically, December is supposed to be the best month for dividends/interest payouts).

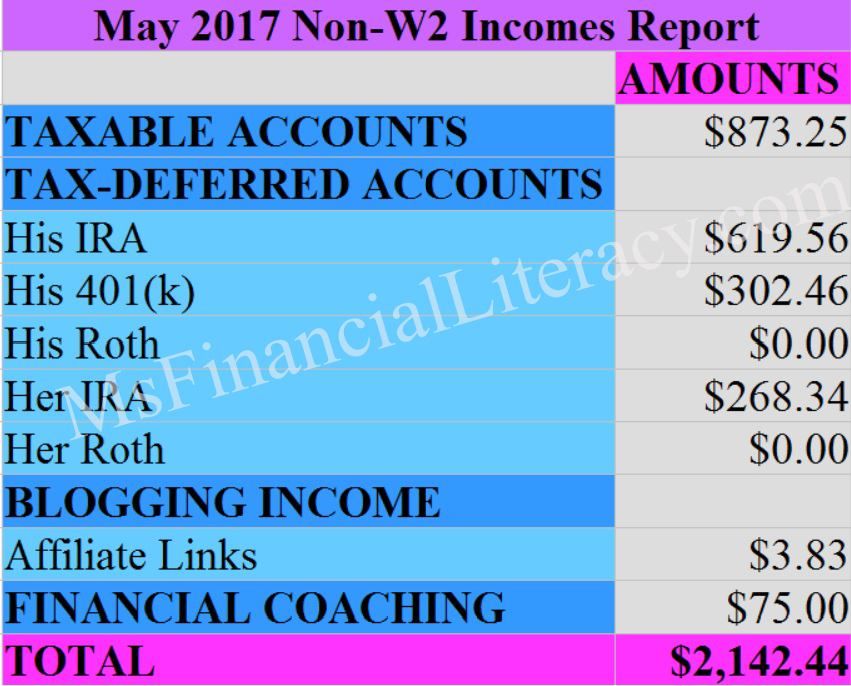
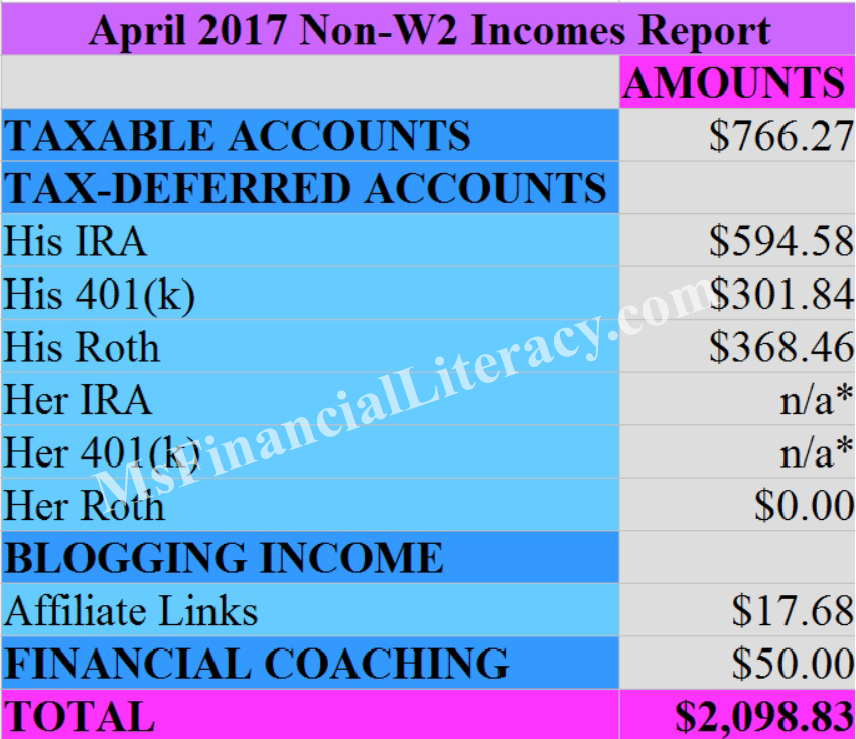
If you follow our previous 2017 non-W2 income reports up to June, our average is $3,528.23 = [($8,021.13 + $2,142.44 + $2098.93 + $5,249.31 + $1,704.66 + $1,952.92)] / 6 months

This $3,528.23 number is very close to our estimated monthly expenses. By definition, my family and I have currently reached the financial freedom stage.

Wealth Building Strategies We Use

My husband and I attribute this favorable return on our investments on the following factors:

(1) We continue to have a high savings rate;

(2) We continue to build our investment portfolio using our savings;

(3) Having a well-managed investment portfolio (we slightly adjusted our asset allocations back in September 2016 – types of equities, percentages and diversification);

(4) We continue to learn new things financially and put new knowledge into actions;

(5) We openly talk about and discuss money topics with others (once in a while we learn something new in the process); and

(6) We use Personal Capital, a free financial tool, to track our net worth, view our investment performance, analyze our asset allocations and project our retirement goals. I wrote a comprehensive review of Personal Capital on another post. I encourage you to check it out.

Like what you’ve just read? I invite you to go to my sidebar and sign up for my free weekly newsletter to receive new post updates.


Embark on a journey learning the financial language, find out what's financially possible for you and become a champion managing your finances!

Spread the message. Encourage others to begin their financial learning!
Financial Freedom, Financial Journey, Financial Planning, Lifestyle, Retirement Planning

May 2017 Non-W2 Incomes Report

Hello readers. Even though it’s not officially summer, it seems like that’s what’s been on everyone’s mind around here. Pool and BBQ parties are in full swing. I briefly looked at upcoming free family events in the city and there are some great ones I plan taking my daughter to this month.

My family and I recently came back from a week-long vacation by the Gulf of Mexico. We spent half of our time in Port Aransas (Mustang Island and North Padre Island) and the other half in South Padre Island (including Port Isabel).

What’s my impression of the Texas coast (several years ago, I also visited Galveston and Rockport)? My view is pretty biased considering that I’ve lived in the California coast for over a decade and have visited some amazing beaches and seen beautiful water in other parts of the world. There’s not much to say about the Texas coast other than it is a good place that tides me over (my craving for beach and sun) until our next vacation to the French Riviera (or other parts of the Mediterranean) or Hawaii.

With that said, I did enjoy my time there. We visited a different beach every day, playing in the sand and putting our feet in the warm gulf water (a very good surprise!). It was a very slow-paced vacation, which was very different than most of the other vacations we’ve had. There wasn’t much else to do other than heading to the beach which was precisely the part that made this vacation very relaxing. We took our time enjoying hour-long breakfasts, meandering along the beach, soaking in the sun and building sandcastles. We also took the time to watch the sunset and go on short cruises.

Of the 8 years that my husband and I have been together, we’ve probably traveled 20 times together. And this most recent trip was the easiest and most relaxing…relaxing in the sense that time didn’t matter as there was no set itinerary.

When we arrived home the following day, we reviewed our finances. And below is a summary of our May 2017 Non-W2 incomes report. The total amount is very similar to that of April 2017. Neither my husband nor I received any dividend/interest payments in our Roths. You’ll also notice that I took out the row tracking “Her 401(k)” and added in a new row now tracking “Her IRA”.

may income report

We started tracking these numbers back in December 2016. You can view our past reports and why we’re doing this here. We use Personal Capital, a free financial tool, to track our net worth, view our investment performance, analyze our asset allocations and project our retirement goals. I wrote a comprehensive review of Personal Capital on another post. I encourage you to check it out.

This is it for now. Thank you for stopping by. I’m looking forward to our June numbers. According to my husband, June should be a great month for us. We’ll see. As stated before, this is the first time we’re tracking our non-w2 incomes systematically over a period of time. 

Spread the message. Encourage others to begin their financial learning!
Financial Empowerment, Financial Freedom, Financial Independence, Financial Journey, Financial Planning, Lifestyle, Marriage and Money, Money Habits, Purchase Decisions

My Husband and I Created a Fun Fund!

Our “Fun Fund”

My husband and I recently created a “Fun Fund”. And the size of this fund is about 39.6% of our current projected/planned annual expenses. This Fun Fund includes the following categories: travel (we’d like to do two international trips and two U.S. trips per year as a family), gifts, charity, wardrobe items, entertainment and dining (e.g., treating others to meals; we’re already allocating $1,000 outside of the Fun Fun each month to spend on groceries and family dining).

fun fund

In a previous article, I mentioned that our projected annual expenses for year 2017 (and possibly the near future years, too, at the time of writing) was $50,000. Then, early this month, we’ve decided to move that number back up to $60,000 (our annual expenses in year 2015 and 2016 was $60,000), even though we currently don’t have child care expenses.

With a budget of $50,000, we were allocating about $13,700 toward the categories aforementioned. We’ve (most, I) came to realize such a number was a little over-stretched and won’t bring me much happiness. So, my husband and I looked at our financial numbers again, and we’ve decided that we can spend up to $60,000 a year and still be able to save a lot.

In my husband’s own words: “I feel I’ve lived my 60s while in my 20s, and now I’m living my 30s in my 30s. Maybe I’ll live my 20s while in my 40s!”

Continue Reading

Spread the message. Encourage others to begin their financial learning!
Financial Freedom, Financial Journey, Financial Planning, Retirement Planning

April 2017 Non-W2 Incomes Report

This post brings you another snapshot of our non-W2 incomes reports. We started tracking these numbers back in December 2016. You can view our past reports and why we’re doing this by clicking here.

If you’ve been reading our incomes reports, you might’ve noticed some patterns: the total amount vary from month to month and that some accounts do better in certain months than others. As such, it would be very difficult to structure our financial life around these numbers on a month-to-month basis. Once we have a full year of tracking, then we’d have a better idea.

April 2017 non-w2 incomes report

The total amount in April 2017 was $2,098.83. This number is a little misleading. I did a 401(k) rollover in mid April (you can read about my experience here) and decided not to track the dividends/interest payments until May.

My Roth account didn’t receive any payments. I only have a few stock tickers in this account. On the other hand, the financial coaching income resumed. My husband recently started working with a new client. He’s currently accepting new clients. Let’s connect if you’re interested in the financial coaching he provides.

This is it for now. Our goal is to get these reports out during the first week of each month. Now that we’re mostly settled into our new life routines, we’re making this a goal once again!

Spread the message. Encourage others to begin their financial learning!
Financial Freedom, Financial Journey, Financial Planning, Investment, Lifestyle, Retirement Planning

March 2017 Non-W2 Income Report and First Quarter Recap

You can go here to read about why we’re sharing our non-W2 incomes on the blog. And you can visit this link to see our past non-W2 income reports.

As anticipated, March was a very great month for us. We received a total of $5,249.31 in non-W2 income. Our international stocks (many of which pay out dividends in larger amounts once a quarter) were responsible for the big jump.

march 2017 non-w2 income report

This month’s number plus the January 2017 and February 2017 numbers have brought our first quarter non-W2 income total to $8,906.89. The monthly average is $2,968.96. With our monthly expenses being around $4,000, this monthly average covers about 74% of our expenses.

We anticipate this percentage will be a little higher by the end of the calendar year. Some of our investments have large dividends/interest payouts bi-annually or annually. Additionally, we continue to make new contributions to most of our accounts. We’ll see as we continue to track these numbers.

April’s chart will look slightly different as I recently did a 401(k) rollover.

We use Personal Capital, a free financial tool, to track our net worth, view our investment performance, analyze our asset allocations and project our retirement goals. I wrote a comprehensive review of Personal Capital in another post. I encourage you to check it out.

Like what you’ve just read? Sign up for my free weekly newsletter to receive new post updates. Posts have been very sparse lately as my family and I are adjusting to a new lifestyle. I hope to resume posting two to three times weekly starting in May. In the meantime, feel free to connect with me on Twitter or Facebook. As always, thanks for reading.

Spread the message. Encourage others to begin their financial learning!