Years to FI Table: Savings Rate and What You Have Saved
Find your years to financial independence from two numbers: your savings rate and the years of spending you already hold. Assumptions shown, 5% real return.
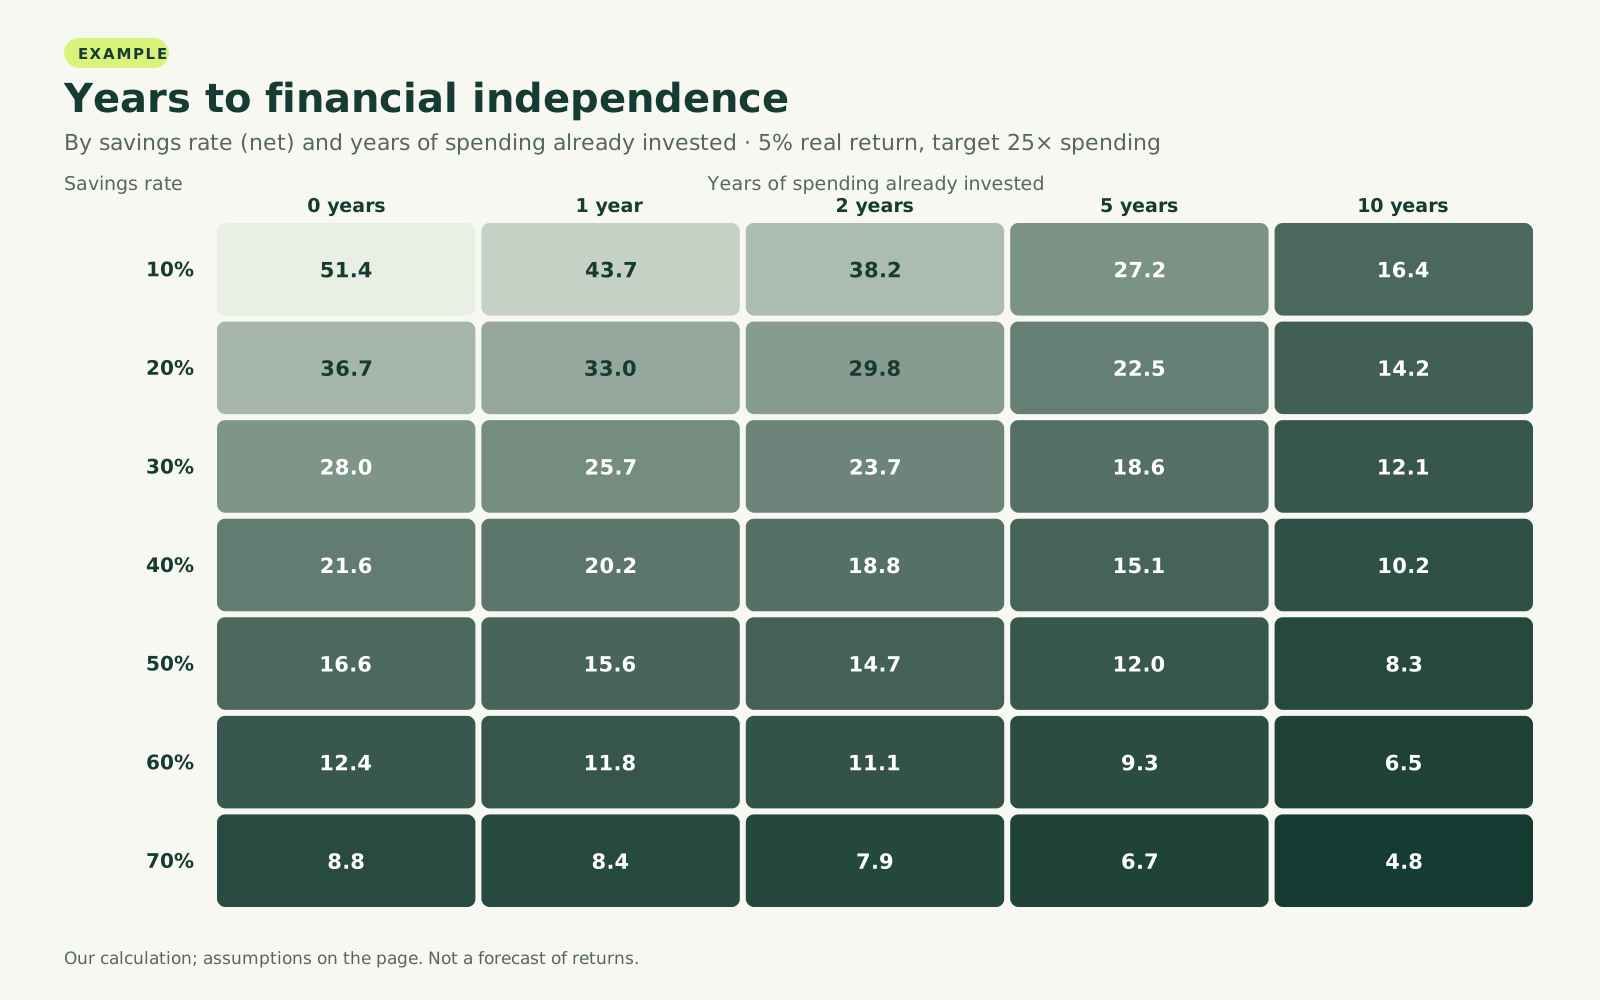
Most years-to-FI tables assume you start with nothing. If you already have savings, read the row for your savings rate and the column for how many years of spending you have invested. Example: at a 30% savings rate with five years of spending already invested, the table gives 18.6 years to reach 25 times your spending, not the 28 years a zero-balance table shows. Your income never enters the calculation.
The assumptions, before the numbers
The table is arithmetic. It is not a forecast, and it rests on five assumptions:
- Target: 25 times annual spending. That is the inverse of a 4% first-year withdrawal. In Bengen's 1994 study of US market history, a 4% withdrawal raised each year for inflation never ran out of money in less than 33 years.1 The 4% rule guide explains why longer retirements call for a lower rate.
- Return: 5% a year after inflation, every year. Real markets do not move in a straight line. The S&P 500, dividends included, lost 36.55% in 2008 and gained 25.94% in 2009.2
- Spending stays the same in today's dollars, both before and after FI.
- Savings rate on the net basis: savings ÷ (savings + spending).
- No taxes, fees, Social Security or pensions. Savings go in once, at the end of each year.
Your two inputs
Savings rate. Divide what you save in a year by what you save plus what you spend. Count 401(k) deferrals and the employer match in savings. A gross rate, taken as a share of pre-tax pay, will put you in a row that is too low, which makes you look further from FI than you are. The savings rate guide covers what counts and how to check the result.
Years of spending already invested. Divide your long-term invested balance (retirement accounts plus taxable brokerage) by your annual spending. Leave out home equity, since you still need somewhere to live, and leave out the cash you keep for emergencies. Example: $280,000 invested against $56,000 a year of spending is 5.0 years.
If your income varies, use the past 12 months for both inputs, not your best month.
Years to financial independence by savings rate and starting balance
Years until the portfolio reaches 25 times annual spending, 5% real return. Our calculation, an example under the assumptions above, not a forecast.
| Savings rate | 0 years saved | 1 year | 2 years | 5 years | 10 years |
|---|---|---|---|---|---|
| 10% | 51.4 | 43.7 | 38.2 | 27.2 | 16.4 |
| 20% | 36.7 | 33.0 | 29.8 | 22.5 | 14.2 |
| 30% | 28.0 | 25.7 | 23.7 | 18.6 | 12.1 |
| 40% | 21.6 | 20.2 | 18.8 | 15.1 | 10.2 |
| 50% | 16.6 | 15.6 | 14.7 | 12.0 | 8.3 |
| 60% | 12.4 | 11.8 | 11.1 | 9.3 | 6.5 |
| 70% | 8.8 | 8.4 | 7.9 | 6.7 | 4.8 |
If you fall between two columns, read both and take a value in between. The first column, rounded, is the zero-balance table in the savings rate guide.
Why income drops out
Measure everything in years of your own spending and the dollar amounts cancel. A 30% savings rate means you save 30 for every 70 you spend, so each year adds 0.43 years of spending to the portfolio. The target is 25 years of spending. The balance you have now is so many years of spending. For example, a household on $60,000 and one on $200,000 with the same rate and the same years saved land in the same cell.
Check one cell yourself
If you'd rather not trust a table, rebuild a cell. Example, a hypothetical household that spends $56,000 a year, saves $24,000 (a 30% rate) and has $280,000 invested (5 years):
- Yearly saving in years of spending: 24,000 ÷ 56,000 = 0.4286.
- Divide by the return: 0.4286 ÷ 0.05 = 8.571.
- (25 + 8.571) ÷ (5 + 8.571) = 2.474.
- ln(2.474) ÷ ln(1.05) = 0.9057 ÷ 0.0488 = 18.6 years.
The general form is n = ln[(25 + s/g) ÷ (b + s/g)] ÷ ln(1 + g), where s is yearly saving in years of spending, b is years already saved and g is the real return.
The year-by-year version gives the same answer. Start at $280,000; each year multiply by 1.05 and add $24,000. After year 1 you have $318,000. After year 18 you have $1,349,031, still under the $1,400,000 target. After year 19 you have $1,440,482. The target is crossed during year 19, which the formula reports as 18.6. A spreadsheet reproduces these balances exactly. The SEC's compound interest calculator on Investor.gov takes contributions monthly, not once a year, so its balances come out somewhat higher; treat it as a rough cross-check.3
Rate or balance: which moves you faster now
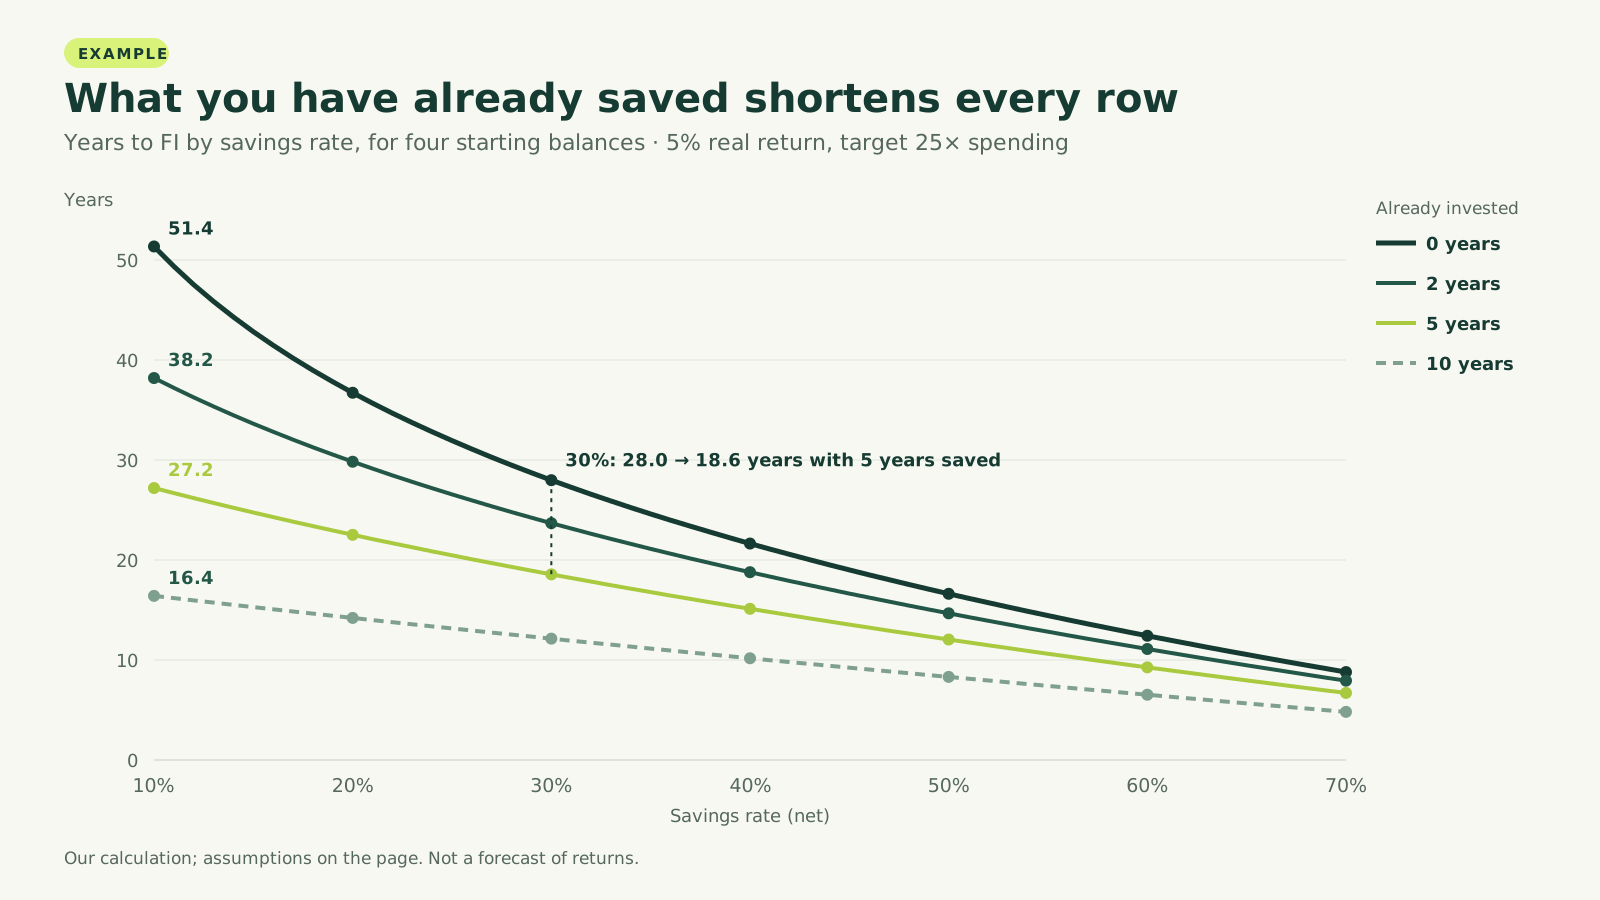
Example from the table: at 30% with two years saved, raising the rate to 40% cuts the wait from 23.7 to 18.8 years. A one-time addition of one more year of spending, such as a bonus or an inheritance, cuts it to 21.8. The rate wins because it works every year: it adds to the balance and shrinks the spending the target is built on. A lump sum matters most at low rates, where the gap between columns is widest.
Where the table misleads
- Spending after FI is different. If your spending will fall when the mortgage ends or rise when you buy your own health coverage, the target changes. Work out the target from spending after work, not today's budget.
- 25× is a 30-year number. At a 3.5% withdrawal rate the target is about 28.6 times spending. Example: at 30% with five years saved, that moves the answer from 18.6 to 20.6 years.
- Taxes are left out. Money in a traditional 401(k) or IRA owes income tax on the way out, so a pre-tax balance overstates the years of spending it can pay for.
- Returns arrive unevenly. A bad decade early or late can shift the date by years in either direction.
For how the savings rate and withdrawal rate fit together, start at financial independence.
Sources
- Determining Withdrawal Rates Using Historical Data (Journal of Financial Planning, October 1994; FPA reprint, March 2004), William P. Bengen. As of 1994-10-01.
- Historical Returns on Stocks, Bonds and Bills: 1928-2024 (updated January 2026), Aswath Damodaran, NYU Stern School of Business. As of 2024-12-31.
- Compound Interest Calculator, U.S. Securities and Exchange Commission, Investor.gov. As of 2026-10-24.