How to Calculate Your FI Number from Spending After Work
Your FI number is 25 times the spending you will have after work, not today's budget. A worked example adds health cover and taxes and drops the mortgage.
Your FI number is the yearly spending you expect once work stops, multiplied by 25. That multiple matches a 4% first-year withdrawal, the rate that lasted at least 33 years in every period William Bengen tested.1 The spending figure is not today's budget and not your salary: take out the costs that end before you stop working, add the ones a job pays for now (health cover before Medicare, tax on withdrawals), and keep every number in today's dollars. If the money has to last 35 or 40 years, use a larger multiple, about 28.6 or 30.3.2
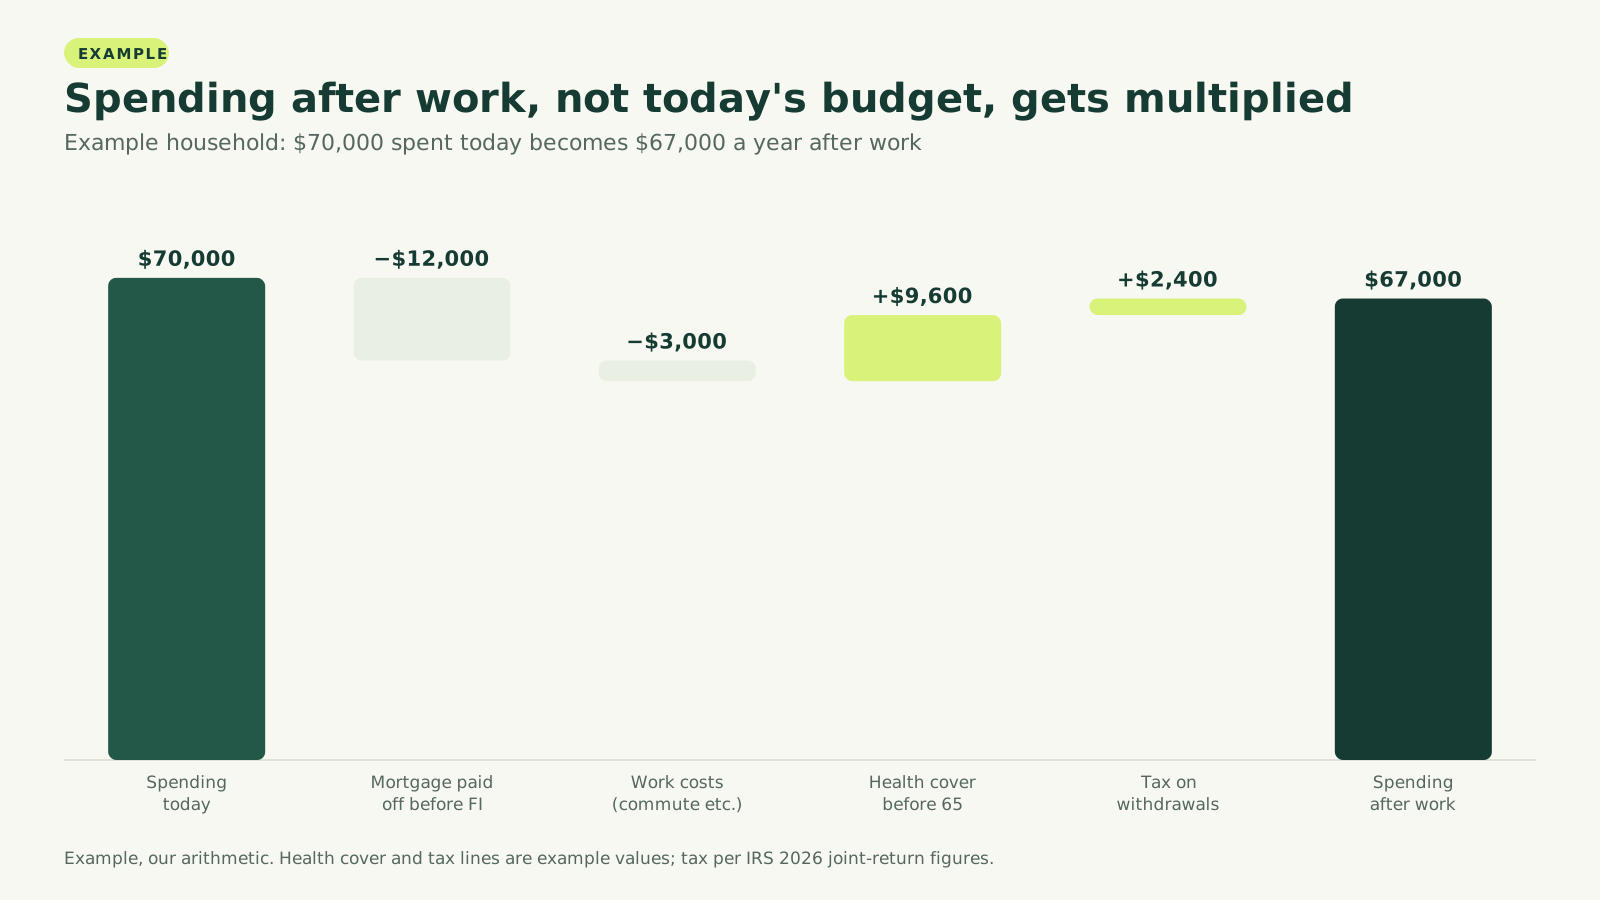
The worked example: $70,000 today, $67,000 after work
Example: a married couple spends $70,000 a year today, counted from bank and card statements, with retirement contributions excluded because they are saving, not spending. They plan to stop working in their late 40s.
| Line | Change | Running total | Why |
|---|---|---|---|
| Spending today | $70,000 | Last 12 months of actual outflows | |
| Mortgage paid off before FI | −$12,000 | $58,000 | Ends before work does, so it stays out of the multiple |
| Work costs | −$3,000 | $55,000 | Commuting, parking, work clothes |
| Health cover before 65 | +$9,600 | $64,600 | Example value: $800 a month for the couple |
| Federal tax on withdrawals | +$2,400 | $67,000 | Worked out below |
| Spending after work | $67,000 | The figure to multiply |
At 25 times, the example target is $1,675,000. Had the couple multiplied today's $70,000, they would have aimed for $1,750,000 and still missed two costs that will show up the year after they quit.
The health line. Medicare covers people 65 or older, so anyone who stops earlier buys cover in the meantime.4 The $9,600 in the example is a placeholder. A real premium depends on age, location and, on the Marketplace, on the income you report, which is why withdrawals and premiums interact. The health coverage guide for early retirees shows how that income sets the price.
The tax line. Taxes are spending, even though no budgeting app files them that way. For 2026 the standard deduction for a married couple filing jointly is $32,200, and the 10% bracket covers the first $24,800 of taxable income.3 Example: the couple draws $56,200 from a traditional 401(k) and $10,800 from Roth contributions and cash, which are not taxed. Taxable income is $56,200 − $32,200 = $24,000, all inside the 10% bracket, so federal income tax is $2,400. The mix of accounts drives this line more than the total does. The same $67,000 drawn entirely from traditional accounts would be taxed more; drawn mostly from Roth money, less. State income tax is not in the example. Withdrawals before 59½ can also carry an extra tax; the guide to getting retirement money before 59½ covers the exceptions.
Build your own spending-after-work figure
The same steps work for any household. Use your own statements; the example values above are only a model.
- Start from actual spending, not income. Twelve months of outflows, minus what went into retirement accounts and investments.
- Remove what ends before you stop working. A mortgage that will be paid off, childcare, commuting, payroll taxes on wages.
- Pull out costs with an end date and fund them separately. A car loan with three years left, or a child's college costs, does not belong in a multiple meant to last for life. Multiplying it by 25 assumes you pay it forever and that it rises with inflation. Price it as a lump sum or a short schedule and add that sum to the target once.
- Add what the job pays for now. Health premiums and out-of-pocket costs until 65, any life or disability cover you want to keep.
- Add tax on withdrawals. Federal and state, based on which accounts the money will come from.
- Add a sinking fund for big irregular costs. Roof, car replacement, appliances: divide the expected cost by the years between replacements.
With kids at home
Children make the number feel unknowable, but most of the uncertainty sits in step 3, not in the multiple. Childcare usually ends before an early exit; college is time-limited; food and activities for teenagers rise and then stop. One workable approach is to compute the after-work figure for the years when the kids have left home, then add a separate, time-limited amount for the years they will still be with you after work stops. That turns one vague number into two concrete ones.
Choose the multiple by how long the money has to last
The multiple is just 1 divided by the withdrawal rate. The research behind each rate assumed a different horizon:
| Withdrawal rate | Multiple | Horizon it was tested for | Source |
|---|---|---|---|
| 4% | 25× | 30 years; no historical start ran out before 33 years | Bengen 19941 |
| 3.5% | 28.6× | 35 years, 90% probability of money left, 30% to 50% in stocks | Morningstar, Dec. 20252 |
| 3.3% | 30.3× | 40 years, same test, 50% in stocks | Morningstar, Dec. 20252 |
Bengen called 3% "absolutely safe" to the extent history is a guide, because no historical start lasted under 50 years, and he found the same held for rates up to about 3.5%.1 Morningstar's figures use forward-looking return assumptions, not history, so the two sources answer slightly different questions.2 Neither makes any rate safe for a given person.
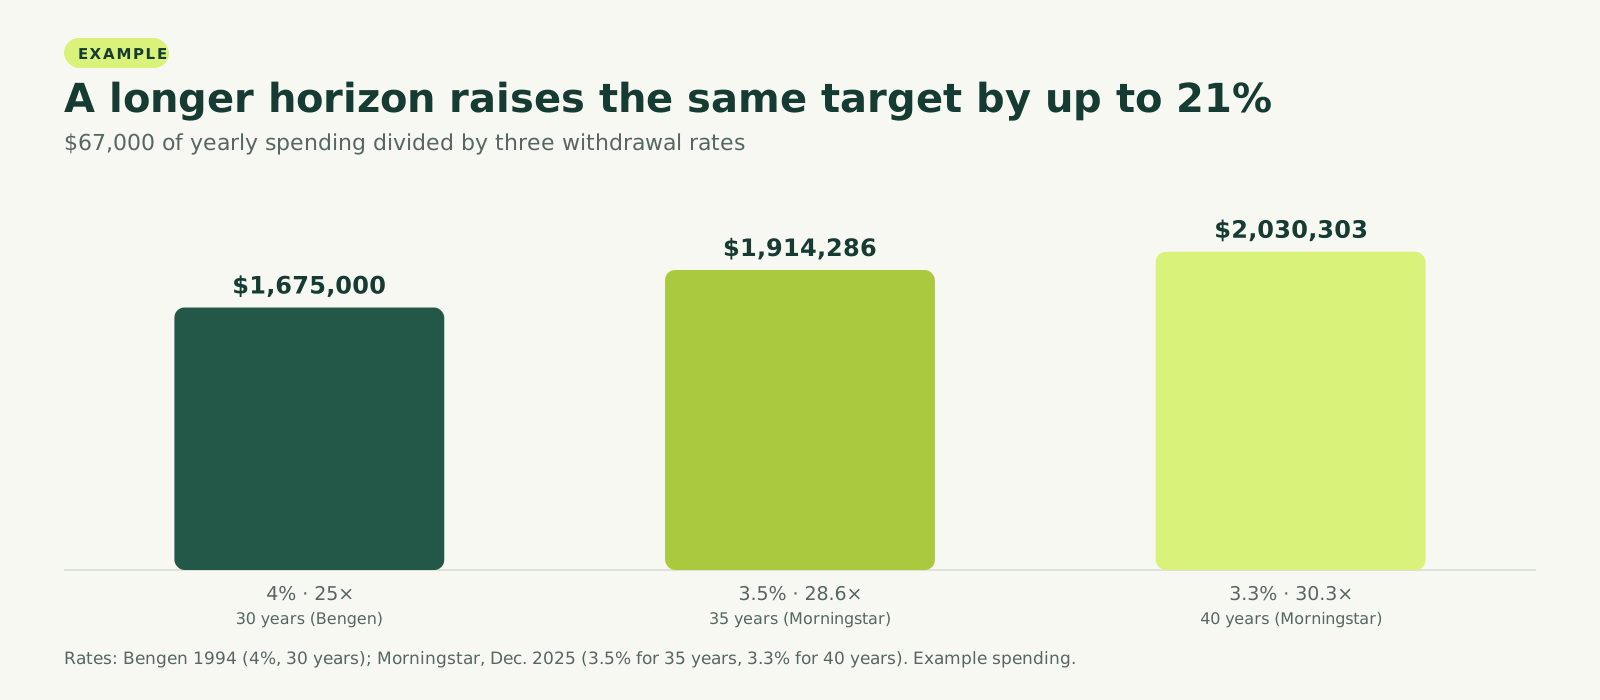
Example: the couple's $67,000 becomes $1,675,000 at 4%, $1,914,286 at 3.5% and $2,030,303 at 3.3%. Moving from 25 to 30.3 times raises the target by about 21%. For a couple stopping in their late 40s, the 40-year row is the honest one to plan against. The 4% rule guide explains what each study assumed and the flexible methods that allow a higher start.
Today's dollars or future dollars: why the target seems to move
A lot of confusion about FI numbers comes from mixing two units. In today's dollars, the example target is $1,675,000 now and $1,675,000 in 20 years, as long as the couple's way of life stays the same. In future dollars, the same goal has a bigger price tag every year.
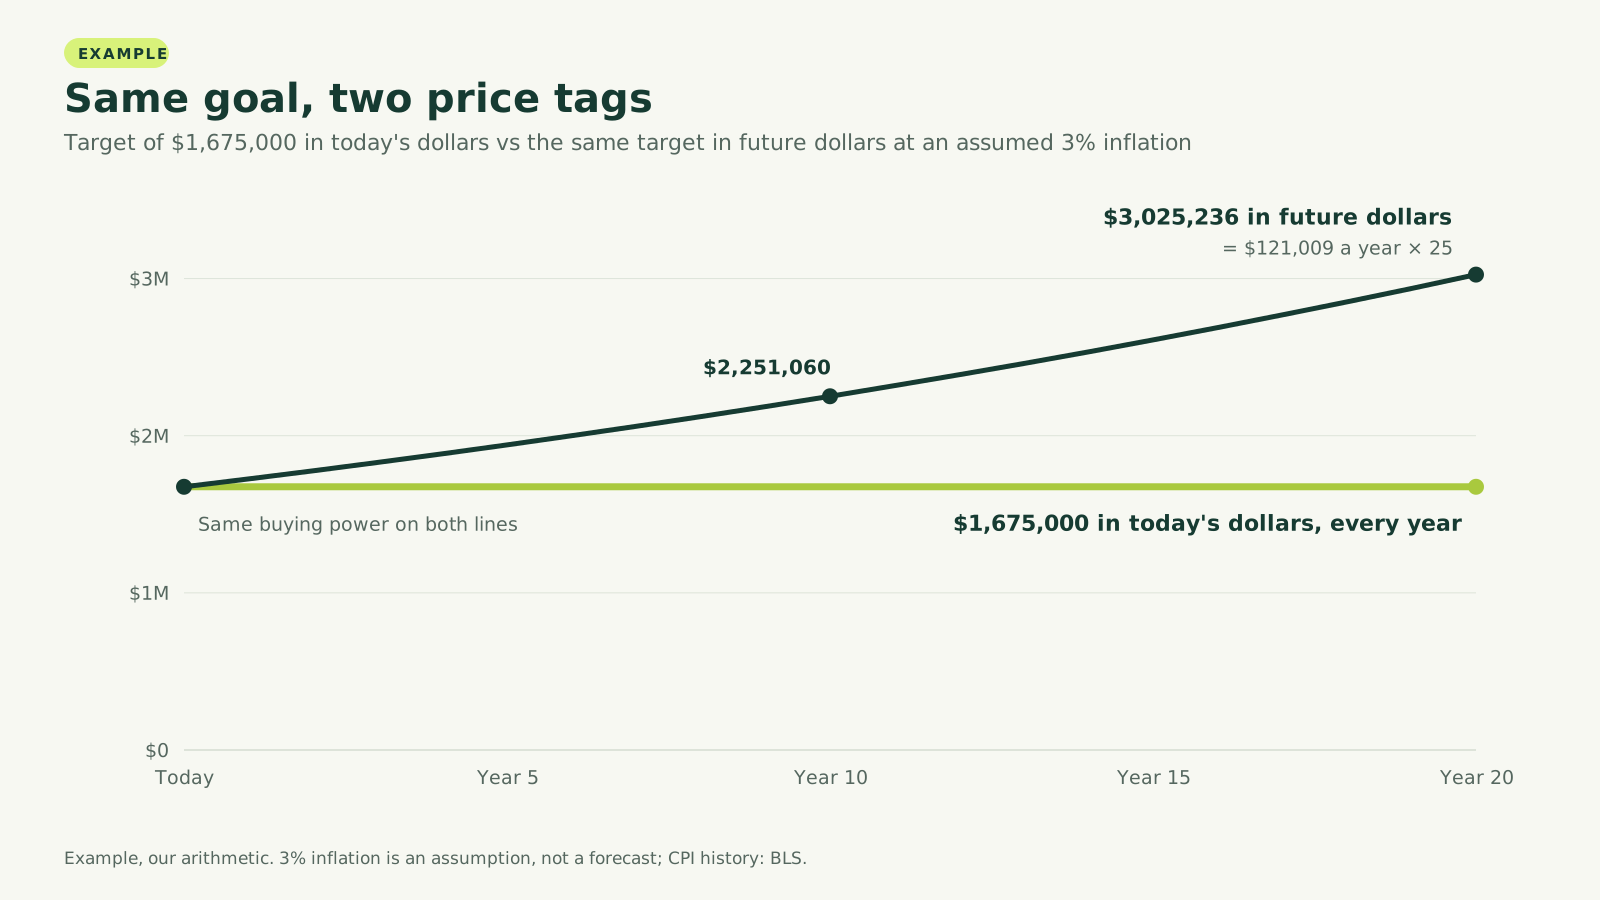
Example, assuming 3% inflation a year:
| Years from now | Target in today's dollars | Same target in future dollars |
|---|---|---|
| 0 | $1,675,000 | $1,675,000 |
| 10 | $1,675,000 | $2,251,060 |
| 20 | $1,675,000 | $3,025,236 |
After 20 years, $67,000 of spending costs about $121,009 in future dollars, and 25 times that is $3,025,236. Both columns describe the same lifestyle. The 3% is an assumption for the example; actual inflation varies, and the Consumer Price Index rose 3.7% in the 12 months to September 2026.6
The rule that keeps the number still: if your spending is in today's dollars, compare it with your portfolio today and project growth with a return after inflation. Never pair today's spending with a nominal return, or a future-dollar target with a real one. Two calculators can disagree simply because each works in a different unit. Check which one you are reading before you trust either.
Three numbers instead of one
A single figure invites false precision. Working with a lean, a base and a comfortable version, each in today's dollars, shows the range you are actually planning for. Example, using the couple's numbers with a lean year that drops travel and dining out and a comfortable year that adds them back:
| Spending after work | At 25× (4%) | At 28.6× (3.5%) | At 30.3× (3.3%) |
|---|---|---|---|
| Lean: $60,000 | $1,500,000 | $1,714,286 | $1,818,182 |
| Base: $67,000 | $1,675,000 | $1,914,286 | $2,030,303 |
| Comfortable: $75,000 | $1,875,000 | $2,142,857 | $2,272,727 |
The lean number is the floor you could live on in a bad decade, the base is the plan, and the comfortable one prices the life you would choose with no constraint. The gap between lean and comfortable is also a measure of how much room you have to cut spending if markets fall early.
How long each number takes to reach depends on your savings rate; the savings-rate guide has the method, and the years-to-FI table gives a timeline from what you have already saved.
Mistakes that move the number the wrong way
Multiplying income instead of spending. A shortcut circulates on forums: (gross income − savings) × 25. Example: a household earning $120,000 that invests $30,000 a year gets $2,250,000. But $20,000 of the remaining $90,000 goes to income and payroll tax on wages, which mostly disappears after work. Its actual spending is $70,000, or $1,750,000 at 25 times, before the after-work adjustments. For heavy savers and high earners, the income shortcut overshoots by years of work.
Counting home equity. The house you live in does not produce income unless you sell it or borrow against it. Leave its value out of the assets you compare with the FI number. Do keep the house's running costs (tax, insurance, upkeep) in spending.
Building temporary debts into the multiple. Example: a $400 monthly car payment with two years left adds $4,800 a year, which turns into $120,000 at 25 times. Paying it off from a separate amount costs about $9,600.
Using 25 times for a 45-year retirement. The 4% studies were built around 30 years.1 For 40, the published estimate is 3.3%, or about 30 times.2
Never updating it. Spending after work is a forecast. Recompute it once a year from fresh statements, in the same units, and keep the old figures so you can see what actually changed.
Where Social Security fits
Social Security retirement benefits can start at 62 at the earliest, and full retirement age is 67 for anyone born in 1960 or later.5 For someone stopping work in their 40s, that leaves 15 to 20 years in which the portfolio pays the full $67,000 alone. A benefit therefore lowers what the portfolio must cover later, not from day one. A simple way to handle it: keep the FI number based on full spending, and treat the benefit as a margin that reduces how much you will have to withdraw after it starts. Subtracting it from spending before multiplying by 25 assumes the benefit arrives in year one. The 4% rule guide explains what the estimate on a benefit statement assumes about future earnings.
Short answers
Is the FI number the same as a retirement number? It is the same arithmetic. "FI" usually signals an earlier exit and therefore a longer horizon, which is why the multiple matters more.
Should taxes be inside spending or added on top of the 4%? Inside. The withdrawal rate in the research is the amount taken out of the portfolio. Bengen assumed all assets sat in tax-deferred accounts,1 and withdrawals from those accounts are taxed as income, so the 4% is a pre-tax amount and the tax comes out of it.
For the larger picture of what financial independence means and how savings rate sets the timeline, see the financial independence hub.
Sources
- Determining Withdrawal Rates Using Historical Data (Journal of Financial Planning, October 1994; FPA reprint, March 2004), William P. Bengen. As of 1994-10-01.
- What's a Safe Retirement Withdrawal Rate for 2026? (table of safe starting rates by time horizon and equity weighting), Morningstar (Amy C. Arnott, Christine Benz, Jason Kephart). As of 2025-12-03.
- IRS releases tax inflation adjustments for tax year 2026, including amendments from the One, Big, Beautiful Bill, Internal Revenue Service. As of 2025-10-09.
- Get started with Medicare, Medicare.gov (Centers for Medicare & Medicaid Services). As of 2026-10-24.
- Retirement Age and Benefit Reduction (Benefits Planner), Social Security Administration. As of 2026-10-24.
- Consumer Price Index, September 2026 (news release of October 14, 2026), U.S. Bureau of Labor Statistics. As of 2026-10-14.